Statistics
Statistical overview of important indicators in tourism in Bled is presented in order to serve as a basis for the preparation of marketing plans and articles about the destination.
Key figures
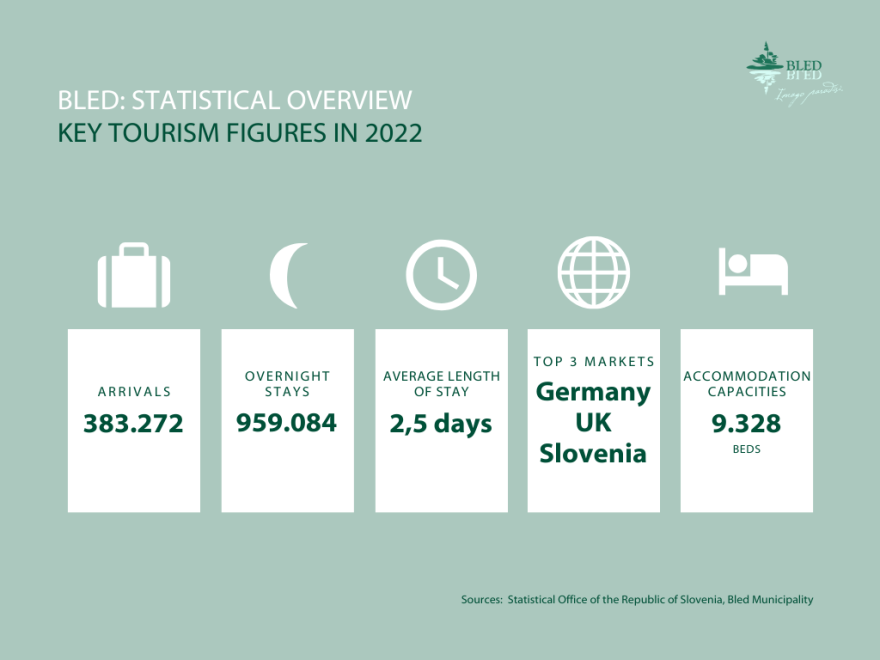
In 2022, 383,272 tourist arrivals and 959,084 overnight stays were generated in the municipality of Bled. In that year, the average length of stay was 2.5 days. The strongest markets were Germany, the United Kingdom and Slovenia. In 2022, 9,328 beds were available in Bled.
Tourist arrivals
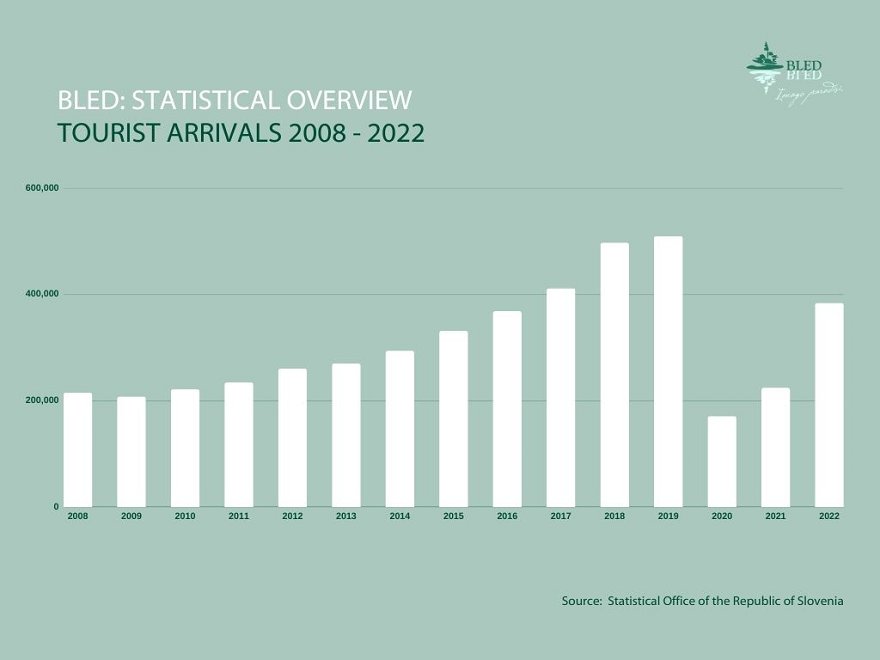
Tourist arrivals in Bled started to increase again in 2021, after a sharp drop in 2020. In 2022, 383,272 tourist arrivals were recorded, which is even more than in 2021 when 223,570 tourist arrivals were recorded.
Tourist arrivals in 2020 and comparison with 2019
Tourist overnight stays in 2019 and comparison with 2018
Tourist overnight stays
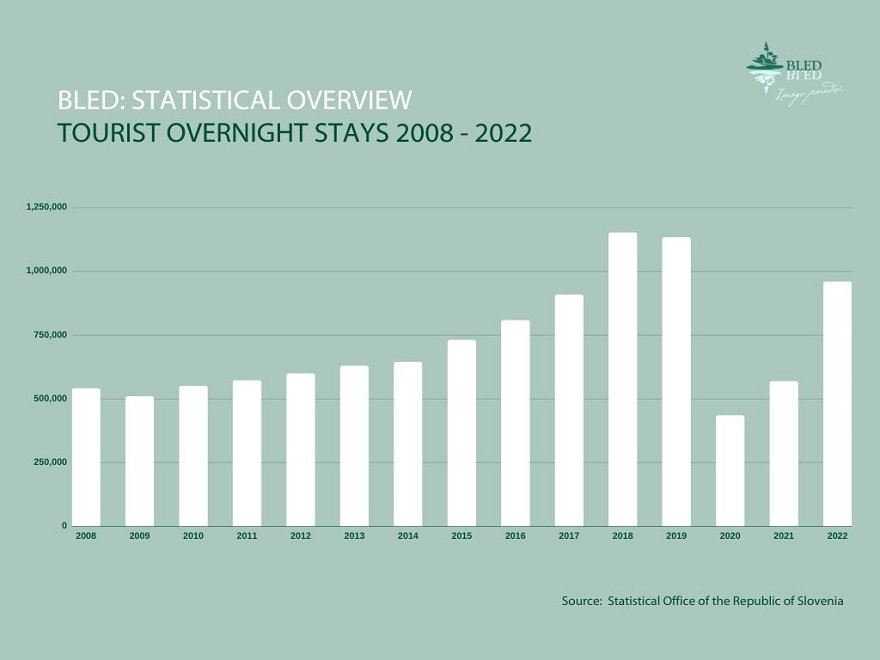
In 2022, 959,084 overnight stays were generated in Bled, up from 568,062 the previous year.
Overnight stays in 2020 and a comparison with 2019
Overnight stays in 2019 and a comparison with 2018
Market overview
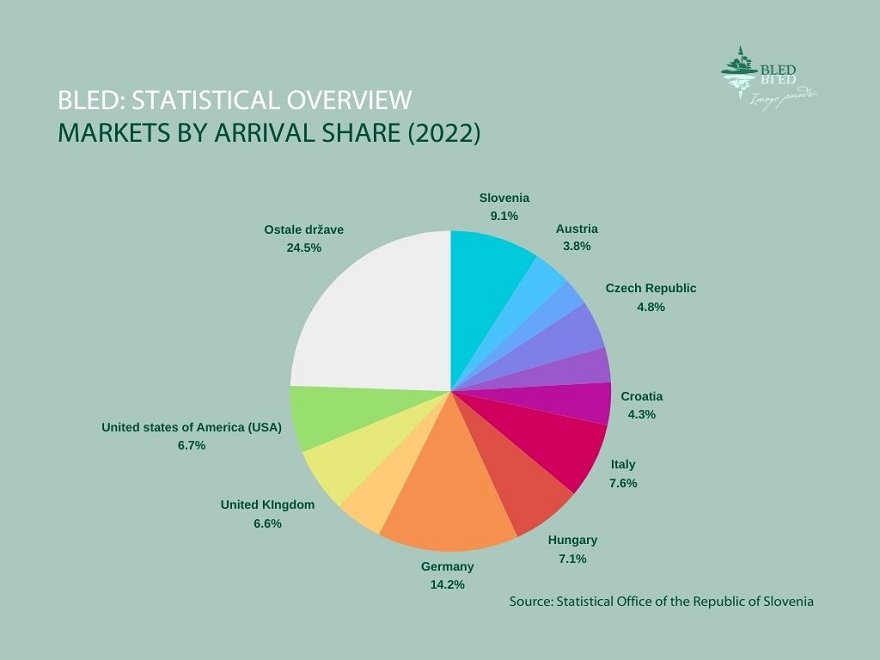
Markets by arrival share: In 2022, 93.3% of arrivals were from foreign visitors. The three most important markets were German, Slovenian and Italian. German guests accounted for 14.2% of arrivals in 2022, Slovenian guests 9.1% and Italian guests 7.6%, followed by Hungary (7.1% of arrivals), the United States (6.7%), the United Kingdom (6.6%), the Netherlands (4.9%), the Czech Republic (4.8%), Croatia (4.3%) and Austria (3.8%).
Markets by overnight stay share: In 2022, 92.9% of overnight stays were generated by foreign guests. In 2022, the largest share of overnight stays was generated by guests from Germany (16.4%), the United Kingdom (8%) and Hungary (7%).
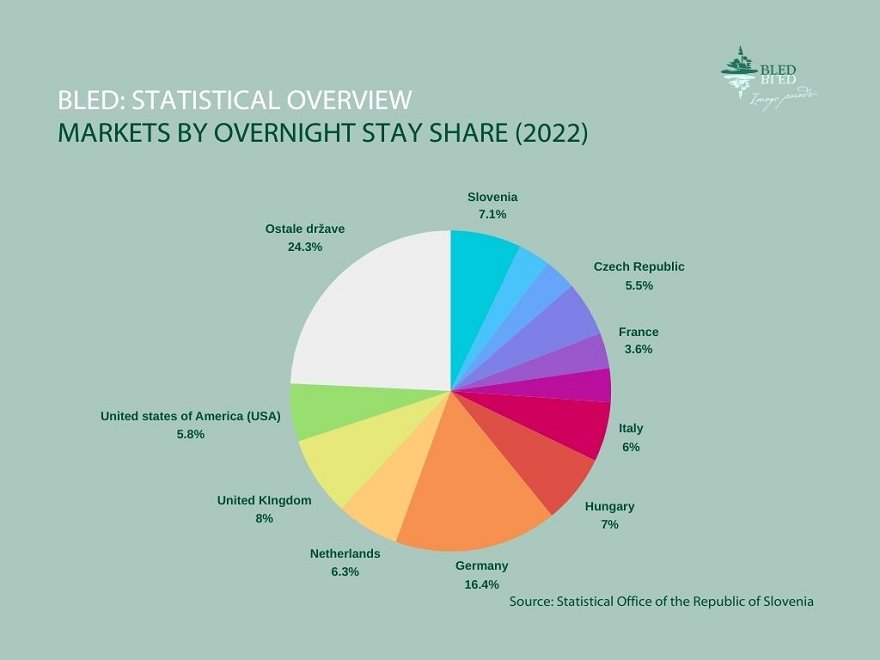
An overview of tourist overnight stays by major markets in 2020 and a comparison with 2019
An overview of tourist overnight stays by major markets in 2019 and a comparison with 2018
The data on arrivals and overnight stays are sourced from the official statistics released by the Statistical Office of the Republic of Slovenia.
Accommodation establishments capacity
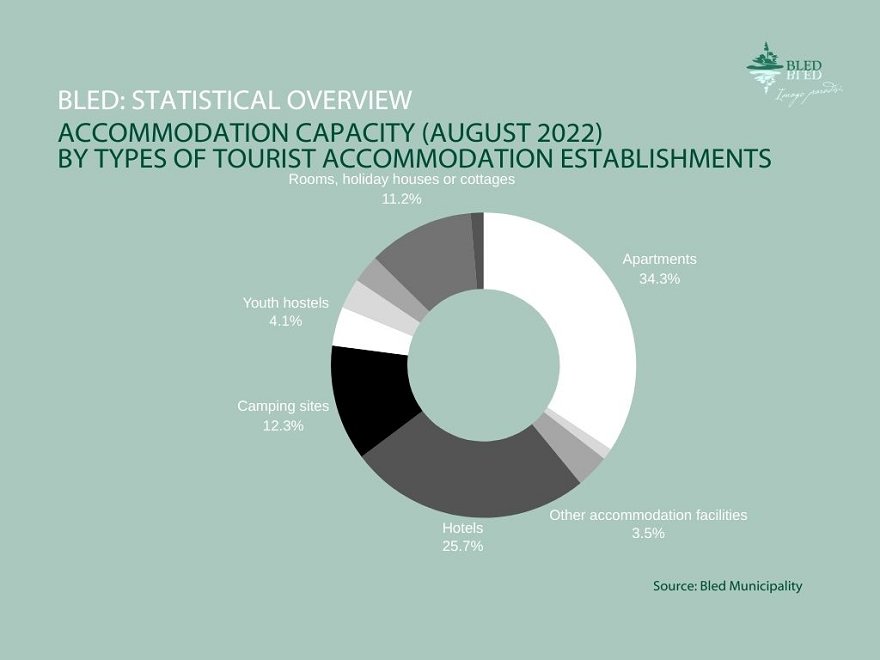
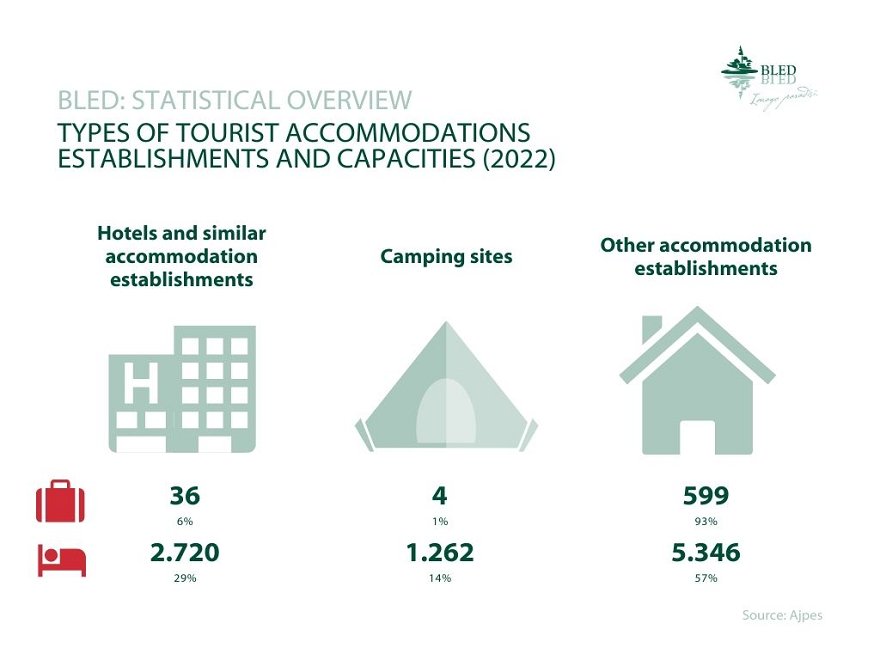
In August 2022, according to the Municipality of Bled, there were 9,328 permanent bed places available.
The largest number of accommodation providers were apartments (34.3%) and hotels (25.7%), followed by camping sites (12.3%), rooms, holiday houses and cottages (11.2%).
Accommodation establishments capacity overview - August 2019
